

|
📈 Comparing Housing Prices vs. Inflation 📈
Increases in average home prices have far exceeded the rate of inflation. Home prices have increased 1,608% since 1970, while inflation has increased 644%.
|
Housing Prices vs. Inflation | 2021: Housing Prices vs. Inflation | Millennials Worse off Than Boomers at 30 | Inflation vs. Income | Housing Price Increases by Metro | Most Affordable Cities, Ranked | Least Affordable Cities, Ranked
Throughout 2021, the inflation rate jumped 7.5% – nearly 4x the Federal Reserve's target inflation rate of 2%.[1] We've seen the effects on the cost of everything from gallons of milk to gallons of gas, but we're also seeing large leaps in the listing prices of homes.
When most baby boomers turned 30 around 1985, the average single-family home cost $82,800. But today, millennials' dollars don't stretch nearly as far. The sense that homeownership is no longer within reach isn't imagined, as the average millennial who turned 30 in 2019 would have spent $313,000 on a typical home — a cost that far outpaces inflation since 1985, when the average baby boomer turned 30.
As we approach the second quarter of 2022, home prices are still high as banks begin to raise mortgage rates to pre-pandemic highs.[2] Meanwhile, price hikes are offsetting wage raises across the nation, rendering increases to annual income far less effective against the rising tide of inflation.[3]
To determine just how these economic shifts are impacting Americans, we analyzed publicly available data from the Federal Reserve Bank of St. Louis, the Zillow Home Value Index, and the U.S. Bureau of Labor Statistics.
We found that home prices have rapidly increased over the last five decades, eclipsing the inflation rate by 150% since 1970. In fact, if home prices grew at the same rate as inflation since 1970, the median home price today would be just $177,788 – rather than $408,100.
Additionally, the median American household's income has just slightly kept ahead of inflation over the last 40 years, leaving many wondering what will happen this year as the inflation rate continues to climb rapidly.
Read on to learn more about home prices vs. inflation – and how they interact to paint a precarious picture for Americans across the nation.
Housing Prices vs. Inflation Stats 💸
|
Housing Price Increases Outpace Inflation by 150% Since 1970
It's no secret that a gallon of milk costs more today than it did just a few years ago or that you're paying more at the pump today than you were even yesterday. But although prices for every good and service have continuously risen over the last 50 years, home-price hikes have taken the lead.
As illustrated in the housing prices vs. inflation chart above, goods and services have continued to increase at a steady incline. Meanwhile, housing prices have spiked wildly, far outpacing the general inflation rate — especially in recent years.
In fact, home prices alone have increased 1,608% since early 1970, while inflation has increased just 644% in comparison. In other words, Americans have seen a steep decline in their purchasing power across the last five decades, especially when it comes to homeownership:
- 🛍 $20,000 in assorted goods in 1970 would cost you $148,800 today.
- 🏠 But a $20,000 house in 1970 would cost you $341,600 today.
A lot has happened since 1970 – wars, supply shortages, and population increases – rendering price hikes over 50 years shocking but unsurprising. Even within a smaller time frame, however, the gap between the growth of home prices and the rise of overall inflation is still significant.
| 💡 What if home prices matched inflation?
Let’s assume that home prices grew at the same rate as inflation since 1970 instead of far faster. Today, the median home sale price in America would be just $177,788 rather than $408,100. And, still, the typical household – with a median income of $67,521 – could barely afford this house! |
How Home Prices Have Changed Across the Decades
Even since just 2000, home prices have grown 121% faster than the cost of general goods. But the difference is even higher since the start of the pandemic.
In just 2020 and 2021 alone, the rise in home prices has exceeded overall inflation by 168%. At these rates, it seems the American Dream has grown more expensive – and potentially unattainable – with not simply every passing decade but every passing year.
Housing Prices vs. Inflation in 2021
High demand coupled with low housing inventory spiked home values in 2021, which grew an average of 20%.
Although the inflation rate jumped to 7.5% from January 2021 to January 2022 – the highest it's been since February 1982 – and home price growth declined slightly during 2021's slow season, the rise in home prices has still exceeded year-over-year growth of inflation by 165% in 2021 alone.
But why?
An inflationary environment, where building materials or other equipment become more expensive, can account for some increases in housing prices. But home values can be affected by a network of different events and circumstances, including population migration and working conditions:
- Inflation: Cost increases in building supplies – such as lumber and paint – added thousands of dollars to the price of new homes in 2021.[4][5]
- Limited Inventory: In contrast, many current owners were holding onto their homes, and a large backlog of new homes grew as home building slowed due to supply chain issues, increasing competition between buyers and driving up prices.
- Low Cost of Debt: Lenders lowered mortgage rates to record lows in 2020, making homeownership more accessible and driving up interest in available homes over two years.
Rises in home values are great news for sellers. Steep price hikes, however, are typically countered with higher mortgage rates, prompting lenders to tighten their lending standards and making it harder for potential buyers to borrow.
But while home prices are expected to continue staggering growth — with Zillow forecasting year-over-year growth reaching 22% this spring — Fannie Mae predicts that high mortgage rates and steep housing prices will temper home appreciation into 2023.[6][7] So although many buyers are priced out of the 2022 market, they may be able to circle back in 2023.
| 🔎 A Closer Look: How Does Inflation Affect Real Estate?
Homes have exponentially increased in value as the years go by. Unlike other goods such as cars, TVs, or cell phones, homes are considered assets, and assets appreciate or depreciate in value as the market fluctuates. For this reason, purchasing a home is an investment – as the value of your home increases, your equity grows. But there's a finite amount of space to build houses, and our population grows every year. Although homeownership has remained an attractive investment since the '70s, there's only so much space to actually place homes. Consequently, home prices outpace inflation rates because homes are consistently in demand but are limited by strained supplies and finite amounts of land on which to build them. Thus, property owners are historically in a great position as prices inflate. Single-family homes typically perform well during inflationary periods and actually outperform the rate of overall inflation, and homeowners can grow their equity as their home values increase. An inflated market, however, can sometimes mean potential buyers will find it difficult to afford homeownership. As costs increase across the market, banks usually increase mortgage rates or tighten lending standards to temper demand. |
Millennials Face 31% Higher Home-Price-to-Income Ratio Than Boomers Did in Their 30s
The American Dream has always been expensive, but with an acceleration in house prices and disproportionate increases in annual income over the past few decades, millennials face a much bigger problem than boomers did at their age.
The average boomer turned 30 in 1985 when the median sale price of a home was just $82,800 and the median household income was $23,620 – that’s a 3.5 home-price-to-income ratio. In other words, homes cost 3.5x what the average American earned in 1985.
To afford a home with the suggested 2.6 ratio, a boomer turning 30 in 1985 would have needed a household income of $31,850, 35% higher than the median household income at the time.
For millennials, who, on average, reached their 30s around 2019, that ratio is significantly higher. The median sale price of a home in 2019 was $313,000, while the median household income was $68,700 – a 4.6 ratio. To afford a home at the suggested 2.6 ratio, the average millennial would need a household income of $120,400, a 75% higher salary than the actual median.
But millennials aren't just combatting inflated housing prices – they also carry more added expenses such as education costs. In fact, after adjusting for inflation, college tuition costs grew 52% between when baby boomers and millennials began attending universities and have spiked an alarming 143% in total since 1963.[8]
Studies show that millennials carry nearly one-third (32%) of all student loan debt in the U.S. Today, millennials in their 30s are forced to balance average student loan debts of $40,500 – the highest of any age group – with their pursuits of homeownership.[9][10]
Combined with high housing prices, large sums of debt can keep the American Dream at arm's length. And for 36% of millennials, this staggering debt has kept homeownership entirely out of reach.[11]
Growth of Median Household Income Barely Beats Inflation Rate
Americans' incomes have lept significantly since 1990 and even more so since 2000. But rising prices are potentially minimizing the impact of income increases. After adjusting for inflation, the median American household income has increased by just 7% in total since 2000 – only 0.3% per year.
Although income just keeps up with inflation rates, continually growing costs and added expenses consume that 7% boost in income.
As digital subscriptions have grown in popularity, the typical household now spends an average of $273 per month for access to things such as Wi-Fi, cloud storage, streaming subscriptions, and gaming platforms.[12] In addition, more than three-quarters of households (78%) report paying a mean of $104 per month on their cell phone bill.[13]
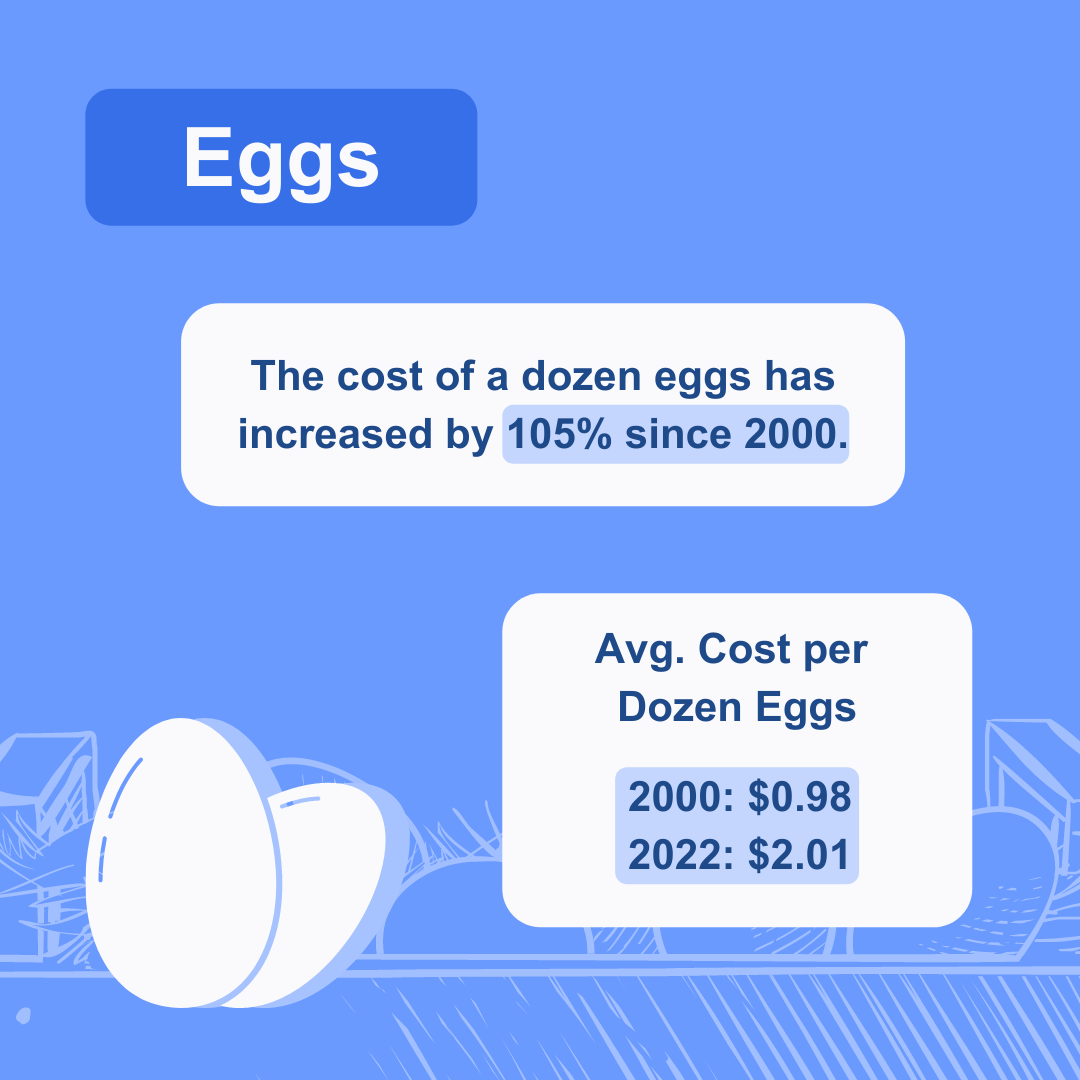
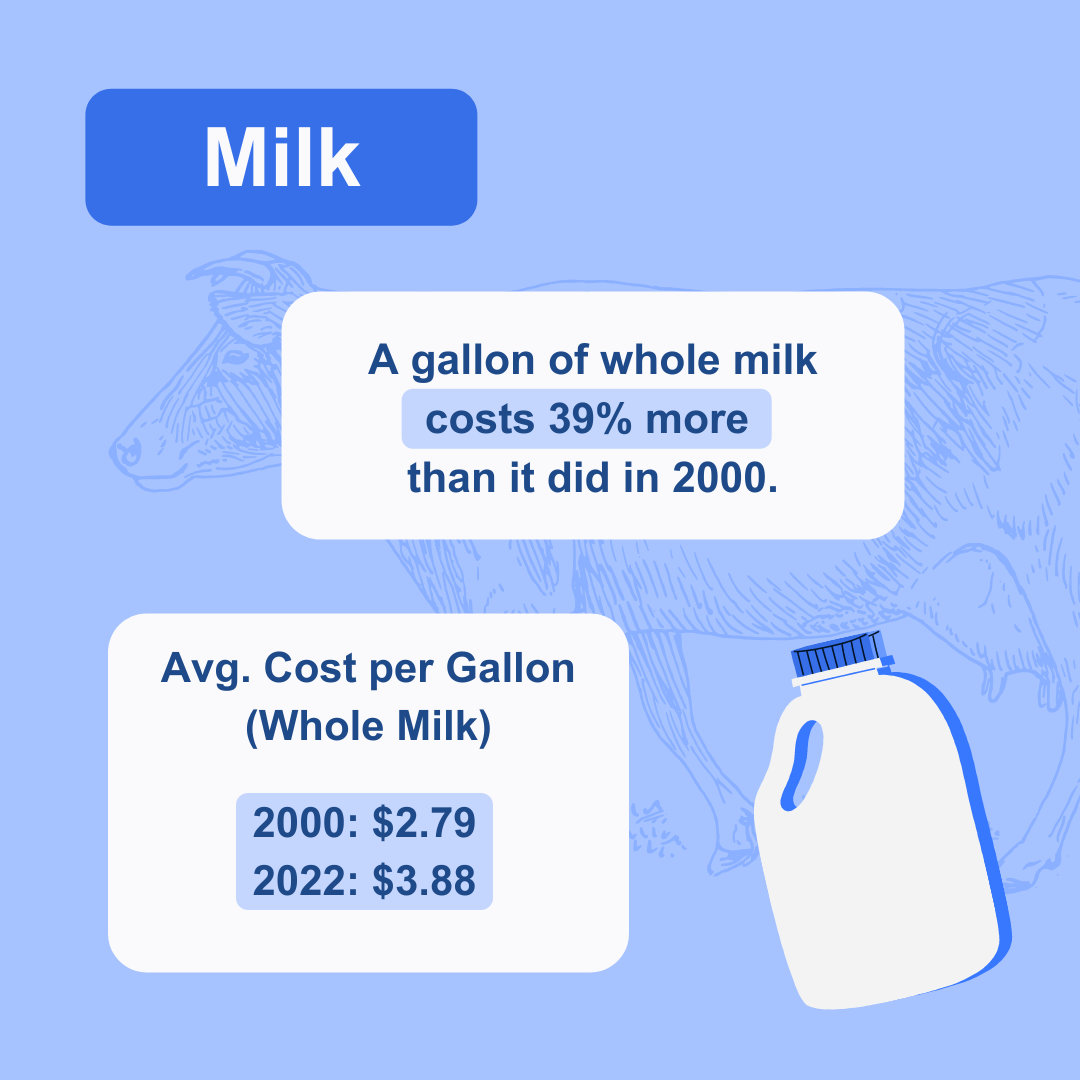
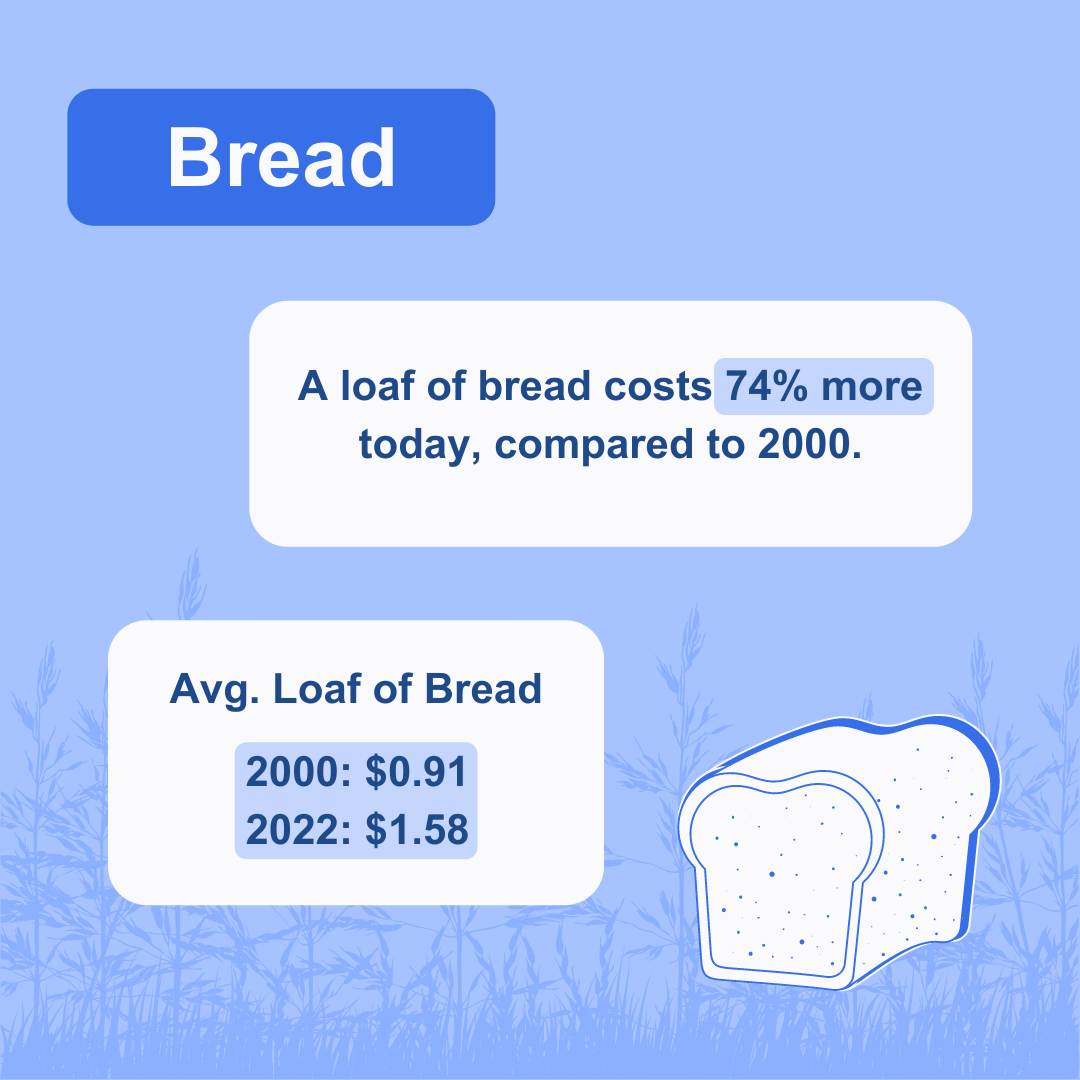
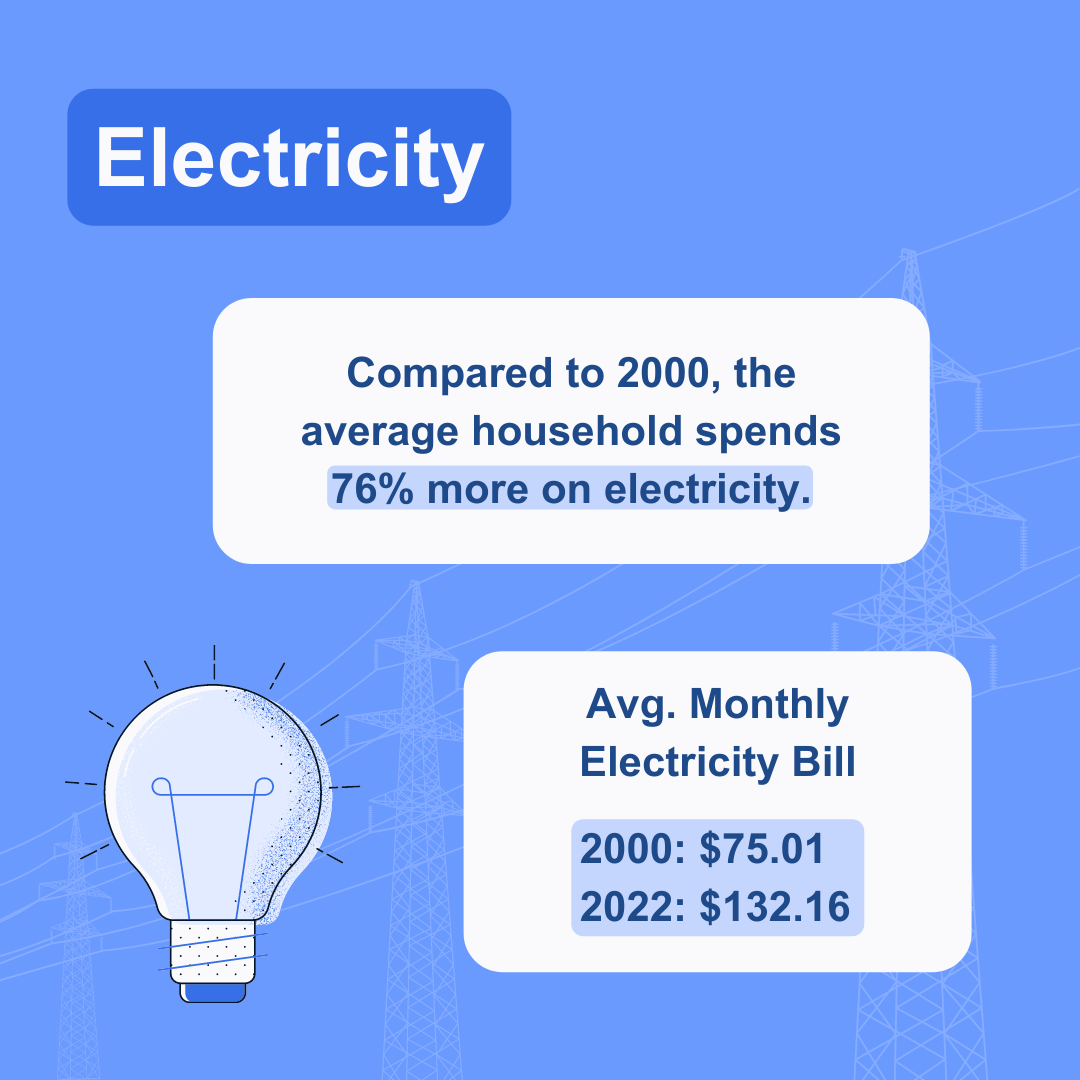
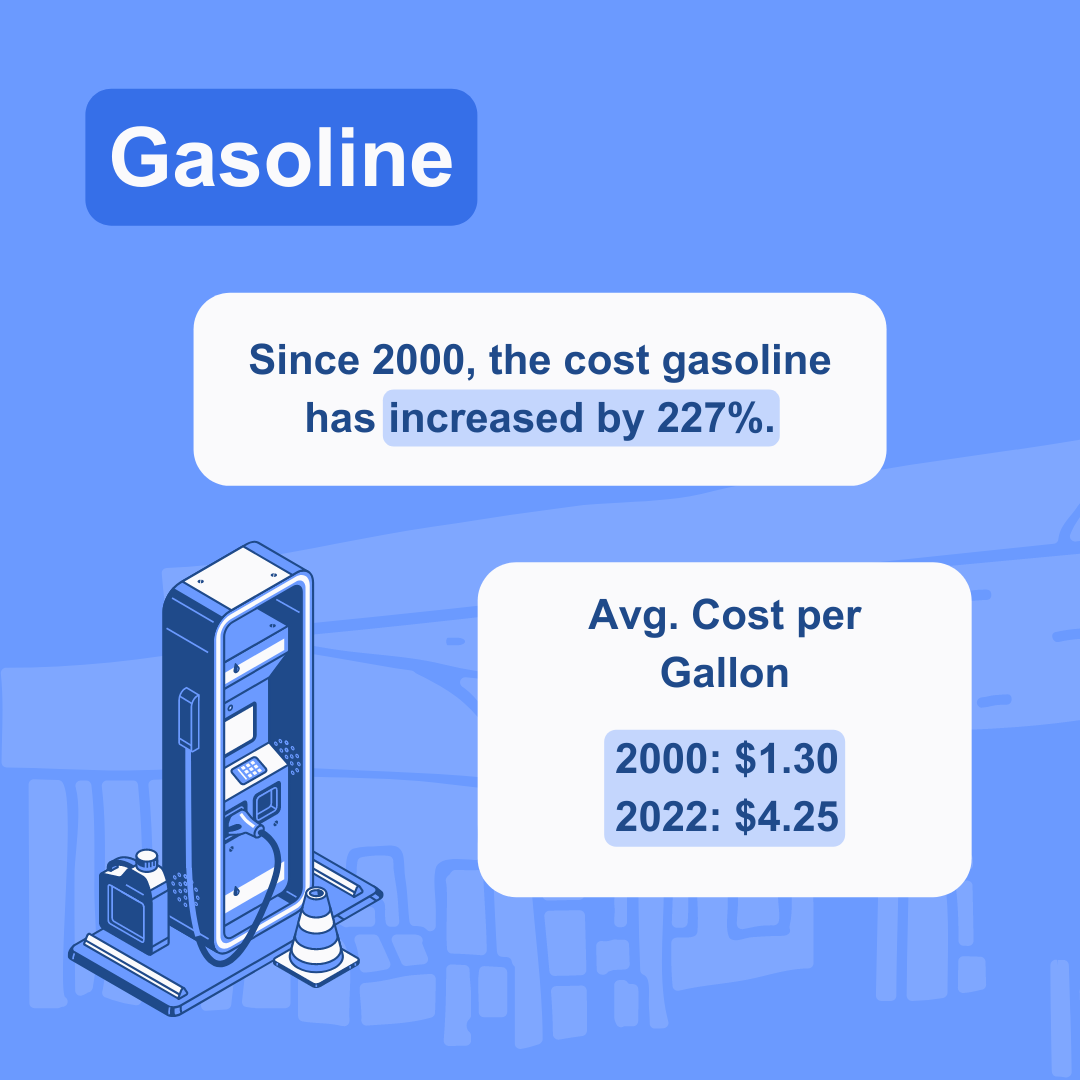
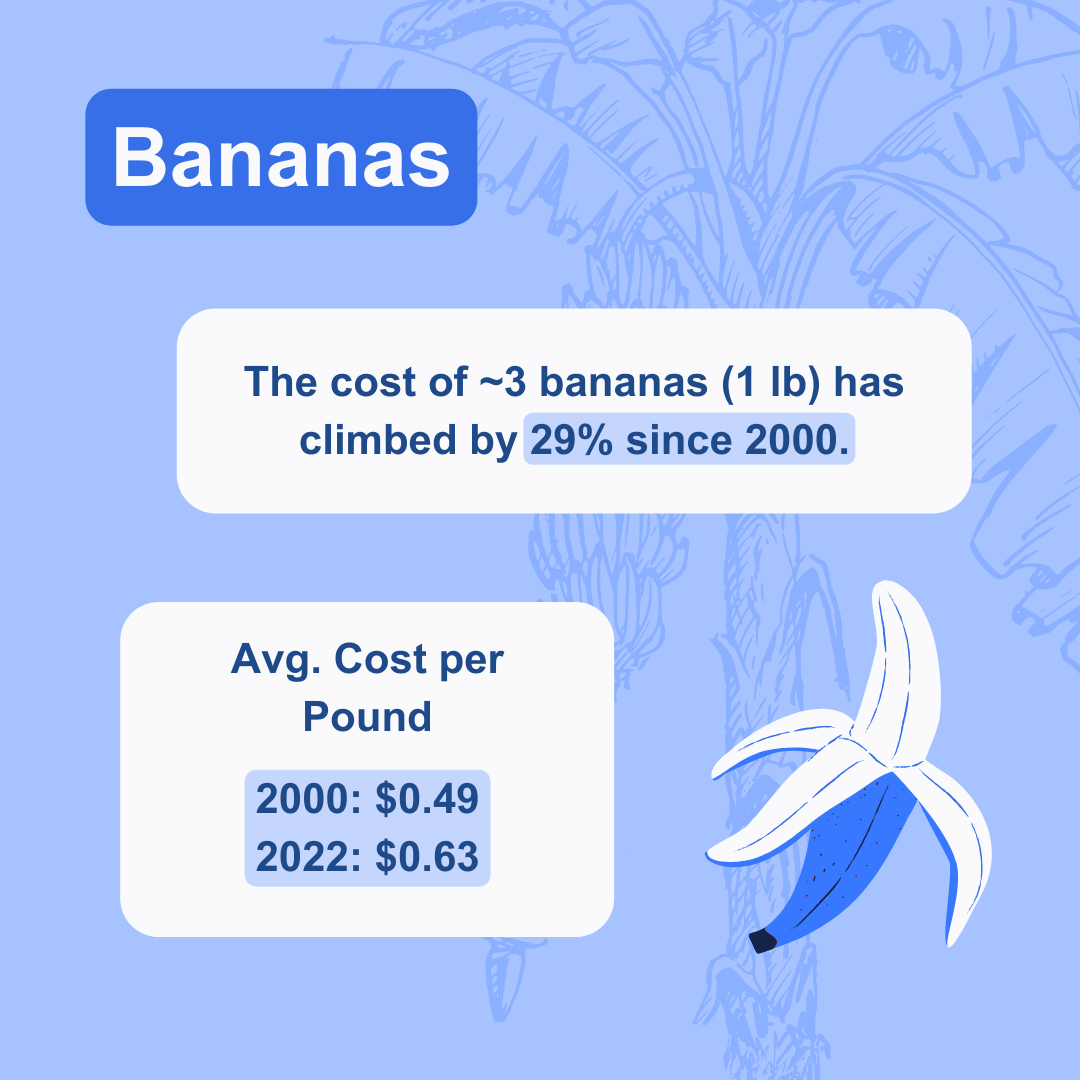
But on top of these added monthly expenses, common household items such as milk, eggs, and utility services have also increased in cost, leaving many with just $250 or less in disposable income every month.[14]
How Much More Are You Spending Now?
 |
 |
 |
 |
 |
 |
| Data retrieved from the Bureau of Labor Statistics Consumer Price Index Databases and the U.S. Energy Information Administration. | |
Housing Prices vs. Income
If you feel like you aren’t gaining any ground in terms of being able to afford everyday life, it's because you're not. The median American household’s income is just slightly keeping ahead of inflation over the last 40 years – and falls far behind what's needed to afford the average home.
The current home-price-to-income ratio sits at 4.8 – 85% higher than the 2.6 that experts recommend. In other words, to afford the average home nationwide, typically valued at $325,677, Americans would need to make $125,260 per year, almost double the current median household income of $67,521.
Changes in Home Values for the 50 Biggest Metros in the U.S. (2000 to 2022)
Homeownership remains one of the most daunting investments for Americans, especially as home prices across the country continue to soar. Although many still manage to bring home groceries or fill up their tank, the average household earns only 56% of the $125,260 needed to afford the average home.
Listing prices rose significantly in 2021 alone, but homes have seen overall value growth since 2000, with most metro areas marking 100 to 200 percent increases over a 22-year span. And even in areas where the increase in the typical home valuation is relatively low, such as Atlanta or Charlotte, N.C., prices are still high.
Only Eight Cities Have Seen Home Prices Increase Less Than 100% Since 2000
Although home values have skyrocketed in recent years, metros such as Cleveland and Detroit have managed to keep home price changes below 100% over a 22-year span – an impressive feat in today's market.
Homes Have Increased in Value by More Than 200% Since 2000 in 13 Cities
Much of the growth seen in home values has, unsurprisingly, centered around California's housing market. Overall, the Golden State's biggest metros have seen an average increase of 277% in the typical home value since 2000, and these cities lead the pack at the national level.
Methodology
Median sales price of homes sold in the United States (MSPUS) are retrieved from the Federal Reserve Bank of St. Louis. For more recent home typical values, we use the Zillow Home Value Index (ZHVI).
As an overall measure of inflation, we use the Consumer Price Index for All Urban Consumers (CPIAUCSL), which measures the average monthly change in the price of goods and services paid by urban consumers between any two time periods. CPIAUCSL data is available through the Federal Reserve Bank of St. Louis.
We also use data on real median household income in the United States provided by the Federal Reserve Bank of St. Louis. This data dates back to 1984 and is adjusted for inflation.
For the prices of household goods, we use the consumer price index (CPI) measure for individual goods provided by the U.S. Bureau of Labor Statistics.
Article Sources
About Anytime Estimate
Stay on top of your money, around the clock. Since 2009, Anytime Estimate's straightforward calculators and expert articles have simplified mortgages, refinancing, and other real estate costs — fast. In 2021, Anytime Estimate was acquired by Clever Real Estate, a free agent-matching service that has helped consumers save more than $82 million on real estate fees. Research by Anytime Estimate's Data Center has been cited by The New York Times, CNBC, MarketWatch, NPR, Apartment Therapy, Yahoo Finance, Black Enterprise, and more.
More Research From Anytime Estimate
Frequently Asked Questions About Home Prices vs Income
How does inflation affect real estate?
Property owners are historically in a great position as prices inflate. Single-family homes typically perform well during inflationary periods, and homeowners can grow their equity as their home values increase. An inflated market, however, can sometimes mean potential buyers have a harder time affording homeownership. Read more about housing prices vs. inflation.
How does inflation affect mortgage rates?
As costs increase across the market, banks usually increase mortgage rates or tighten lending standards to prevent buyers from biting off more than they can chew financially. Read more about housing prices vs. inflation.
Should you buy a house during inflation?
Although high housing prices can be intimidating, the cost of homes has been consistently increasing from year to year and will likely continue to do so, barring any economic crises. Because homes are a great investment, it's a good idea to get your foot in the door as early as possible so that, as prices increase, your home grows in value (and you gain equity)! Read more about housing prices vs. inflation.