
|
🍕 Which state has the best pizza in the U.S.? 🍕
Ohio is the nation's best state for pizza — thanks to high rankings from Cleveland (No. 2), Columbus (No. 3), and Cincinnati (No. 19).
|
People love debating about pizza — almost as much as they love eating it. Pizza connoisseurs can argue over the right way to eat pizza, what toppings to include, and even the origin of the word itself.[1]
When asked what is the best pizza in the world, many point to the pies of Naples, Italy, home of the "modern" pizza.[1] But not everyone can fly to southern Europe in search of baked bliss.
Fortunately, one can find dough-licious pizza right here in the states. Any given day, one in eight Americans will bite into a slice[1] — no surprise
in a nation with more than 78,000 pizzerias.[1]
Though not all pizzas are created equal. Thanks to new 2022 data, we can officially rank the best pizza cities in the U.S.
To create a definitive list of the best cities for pizza, we analyzed publicly available U.S. business data, Census data, economic and labor statistics, and Google Trends data, as well as findings from Thrillist, Pizza Today, Expensivity, and Menu With Price.
We scored the 50 largest metros in the U.S. on their pizza prowess, weighting the criteria as follows:
- 5x: Google Trends interest in 20 pizza variations
- 3x: Pizza restaurants per 100,000 residents
- 2x: Pizza restaurants per square mile
- 2x: Google Trends interest in general pizza terms
- 1x: Independent pizza restaurants per 100,000 residents
- 1x: Average price and affordability of cheese pizza (the cheaper the better)
- 1x: Average price and affordability of pepperoni pizza (the cheaper the better)
- -1x: Big chain pizza restaurants per 100,000 residents
To analyze pizza costs, we looked at two factors: the average price for pizza (combining all sizes, including individual slices) and affordability, which takes into account the typical income for that area. Cities with a high share of independent pizza restaurants
got extra points, and cities dominated by large pizza chains suffered a small penalty.
Read on to find out if your city is part of the upper crust — or crumbles under pressure.
Want to know how much pizza you really eat? Enter your information below to find out!
| 🇺🇸 The Crust Belt Many of the highest-ranking cities on our list are clustered where the Northeast and Midwest converge, indicating the U.S. has a prime region for pizza. |
[inline-image url="5f3fd2e0-94c1-11ec-96f2-43bdd99faa64-long-inline-pizza.png" alt="inline long pizza cafe"]
When it comes to ranking pizza-friendly places in the U.S., 15 cities really deliver. As a group, these metros stand out because:
- The top 15 cities have 10.5 pizzerias per 100,000 residents, 31.3% more than the average city we analyzed.
- The top 15 cities showed passion for a wide variety of pizzas, with a 20.6% higher average Google Trends rating across all 20 pizza varieties we analyzed.
- The top 15 cities have a pizza place every 2.1 miles compared to 2.8 for the average city in our study, a 26% shorter distance.
- The top 15 cities have an average pepperoni pizza price of $7.83 compared to $8.39 for the average city we looked at, a 6.7% difference.
- Buying a pepperoni pizza every week would cost residents in the top 15 cities 0.65% of their annual income compared to the average of 0.71% for all cities we studied.
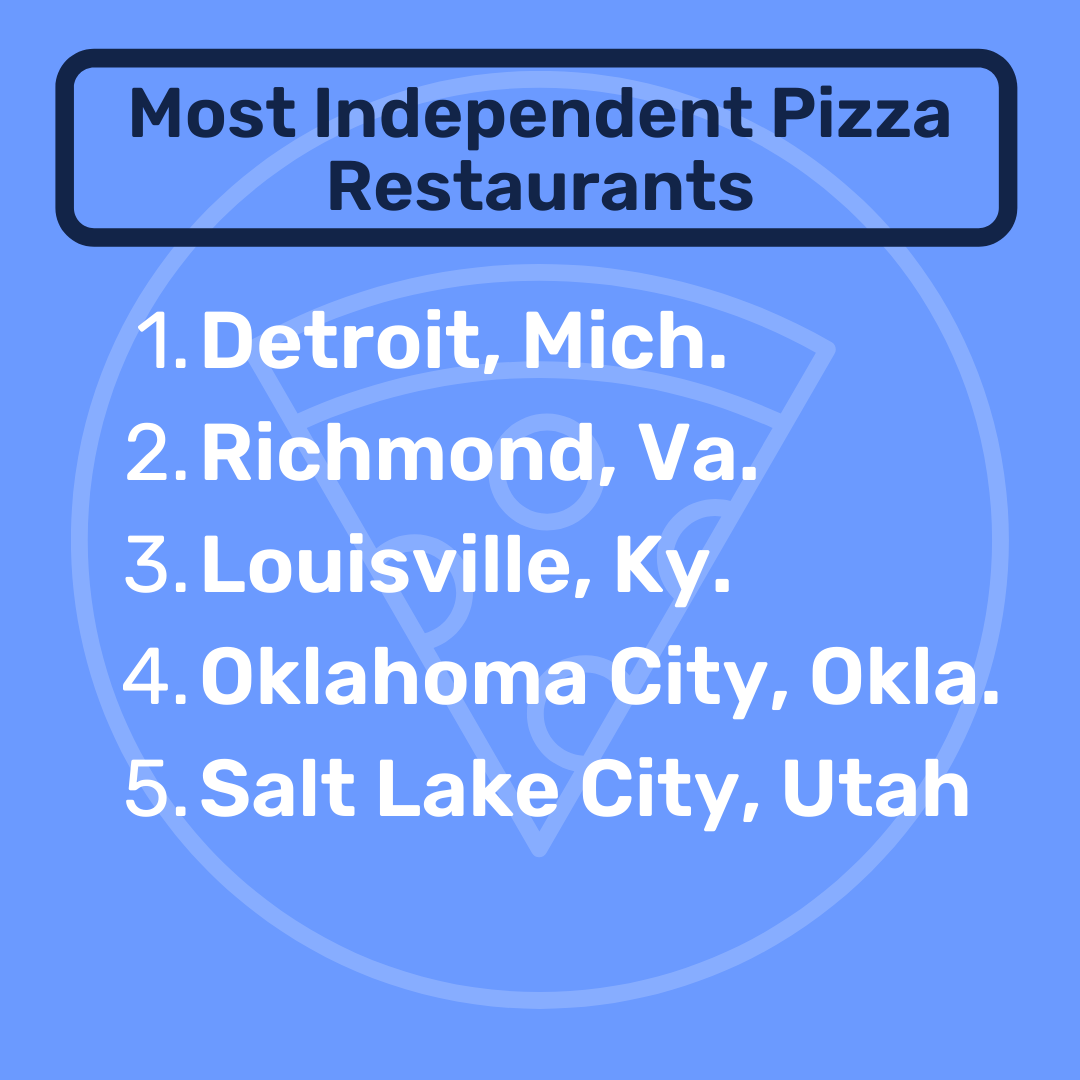
| 🏙️ Motown Is Dough Town Detroit has the most independent pizzerias per capita (6 per 100,000 residents) — nearly double the average of 3.1 in the 50 cities we analyzed. |
No matter how you slice the data, Detroit comes out on top in our 2022 rankings. The Motor City ranks high in multiple metrics, including No. 1 in pizza passion — meaning Detroiters appreciate a wide variety of pizza styles, according to local Google
search trends.
Detroit ranks No. 1 for BBQ chicken pizza searches, No. 2 for Chicago-style pizza, and, of course, tops the rankings when it comes to its hometown creation of Detroit-style pizza: a thick, savory square pie with crisp corners of cheese first innovated
by Buddy's Pizza.[1]
The city best known for its auto industry is also No. 2 for taco pizza, top 10 in pizzeria density (one pizza restaurant every 1.58 miles), and top 10 in best prices for pepperoni pizza ($7.54). Detroit may not be the capital of Michigan, but it's
the true pizza capital of the Midwest — and the country.
| 🌲 Living off The LandAs the top-ranking town for search interest in veggie pizza, Cleveland knows how to use olive the best meatless toppings. |
When it comes to pizza, Cleveland's attitude is anything but cavalier. The home of the Rock and Roll Hall of Fame also boasts one of the strongest pizza cultures in the country.
Cleveland ranks No. 5 in the nation for most pizza restaurants per capita, with 12.3 per 100,000 residents — 54% more than the average city we measured. "The Land" also has some of the best prices for pepperoni pizza, averaging $6.52 (22% cheaper
than the average of $8.39 across the 50 metros studied).
Cleveland enjoys a variety of pie styles, earning it the No. 4 ranking for pizza passion. Specifically, Cleveland is the No. 2 city for search interest in pizza bagels, which won't surprise anyone who's met the famous Pizza Bagel Lady.[1]
3. Columbus, Ohio
| 🎓 A Solid College Cuisine The home of The Ohio State University is a hub for pizza restaurants, with 13.1 pizzerias per 100,000 residents — 64% more than the average city we studied. |
Columbus doesn't just have school spirit, it also has pizza pride. With a Google Trends rating for different types of pizza that's 34% higher than average, Ohio's capital ranks No. 3 in pizza passion.
Someone should throw a pep(peroni) rally, as pepperoni prices in Columbus are among the top 10 cheapest in the country (at $7.24, 14% cheaper than the average city we analyzed). Columbus residents also search for pepperoni pizza third-most of any city, behind only
Houston and Louisville, Ky.
A visit to Columbus will also give you a chance to try a regional specialty — Ohio Valley-style pizza, an unconventional take claimed by DiCarlo's Pizza in which the cheese and toppings are dropped onto the pizza cold after the rest has baked.[1]
[1]
4. Boston, Massachusetts
| ⚾ Red Sox and Red Sauce Boston is loaded with baseball fans and pizza shops. The capital of Massachusetts has the second-most pizzerias per capita (14 per 100,000 residents) — nearly double the average among cities we examined (8 per 100,000). |
The Boston pizza scene is a hit: The town has a pizza shop every 1.27 miles — half the average of the cities we analyzed (2.82 miles). And with help from high average incomes, ordering a cheese pizza each week would cost a Boston resident just 0.55%
of their annual income, 24% cheaper than the typical tally among cities we studied (0.71%).
It's fitting that some have dubbed Boston the "Athens of America"[1] — as no city shows a higher online search interest in Greek-style pizza,[1] which one might find at Boston's University House of Pizza.[1]
Boston also ranks No. 4 in search interest for BBQ chicken pizza and No. 5 for Sicilian pizza.
| ⛓️ Top of the Food ChainPittsburgh has the highest number of pizza restaurants per capita (15.2 per 100,000 residents), though the landscape is dominated by chains. |
Despite a penalty for its volume of chain pizza restaurants (12.9 per 100,000 residents compared to the average of 4.9 in the 50 cities we studied), Pittsburgh ranks high on plenty of pizza metrics.
Pepperoni pizza prices in the Steel City are 19% cheaper than the average among the 50 cities we studied ($6.84 vs. $8.39). That means a weekly pepperoni pie would cost a Pittsburgher just 0.56% of their annual income, better than the national average of 0.71%.
Pittsburgh ranks No. 9 in the country for pizza passion — with a 15% higher average Google Trends rating across all 20 pizza varieties we analyzed. The city also ranks No. 2 for search interest for both veggie pizza and Detroit-style pizza.
6. Indianapolis, Indiana
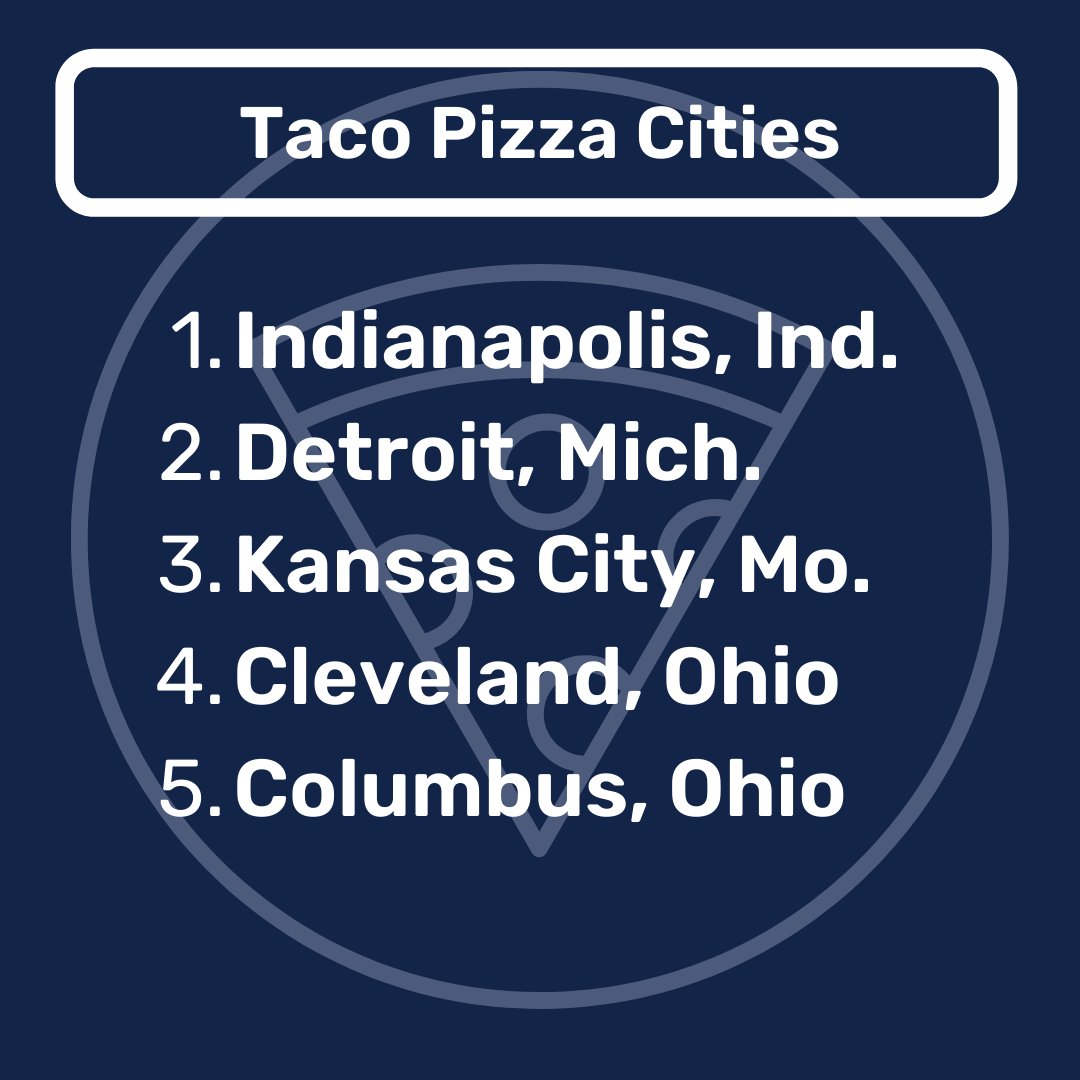
| 🌮 Taco 'Bout a SurpriseDespite its position 1,000 miles from the Mexican border, Indianapolis ranks first in search interest for taco pizza. |
Just outside the top five pizza cities is Indianapolis. The home of the Indy 500 is also home to an independent pizza scene, with four independently operated pizza shops per 100,000 residents — 30% more than the average city we looked at (3.1 per 100,000).
Search data shows Hoosiers value variety in their pizza styles. The city ranks No. 5 in the country in pizza passion, with a 29% higher Google Trends rating across 20 different types of pies.
In addition to holding the top spot for taco pizza, Indianapolis ranks No. 3 in search interest for both sausage pizza and Greek pizza.
7. Providence, Rhode Island
| 🍴 Small State, Big Appetite Providence has 12.5 pizza restaurants per 100,000 residents — the fourth-highest rate in the country, with 56% more pizzerias than the average city we studied. |
When it comes to pizza, Providence punches above its weight. The capital of the smallest state has a pizza place every 1.58 miles — 44% closer than the average of 2.82 miles among cities we analyzed.
Providence ranks No. 1 for search interest in Neapolitan pizza[1] — an authentic Italian variation topped with fresh tomatoes and mozzarella, adored by pizza purists for its association with Naples, Italy.
Rhode Island is also home to pizza strips — described as a thick, cheese-less sheet of baked dough topped with heavy tomato sauce or paste and often found in a bakery rather than a pizzeria.[1]
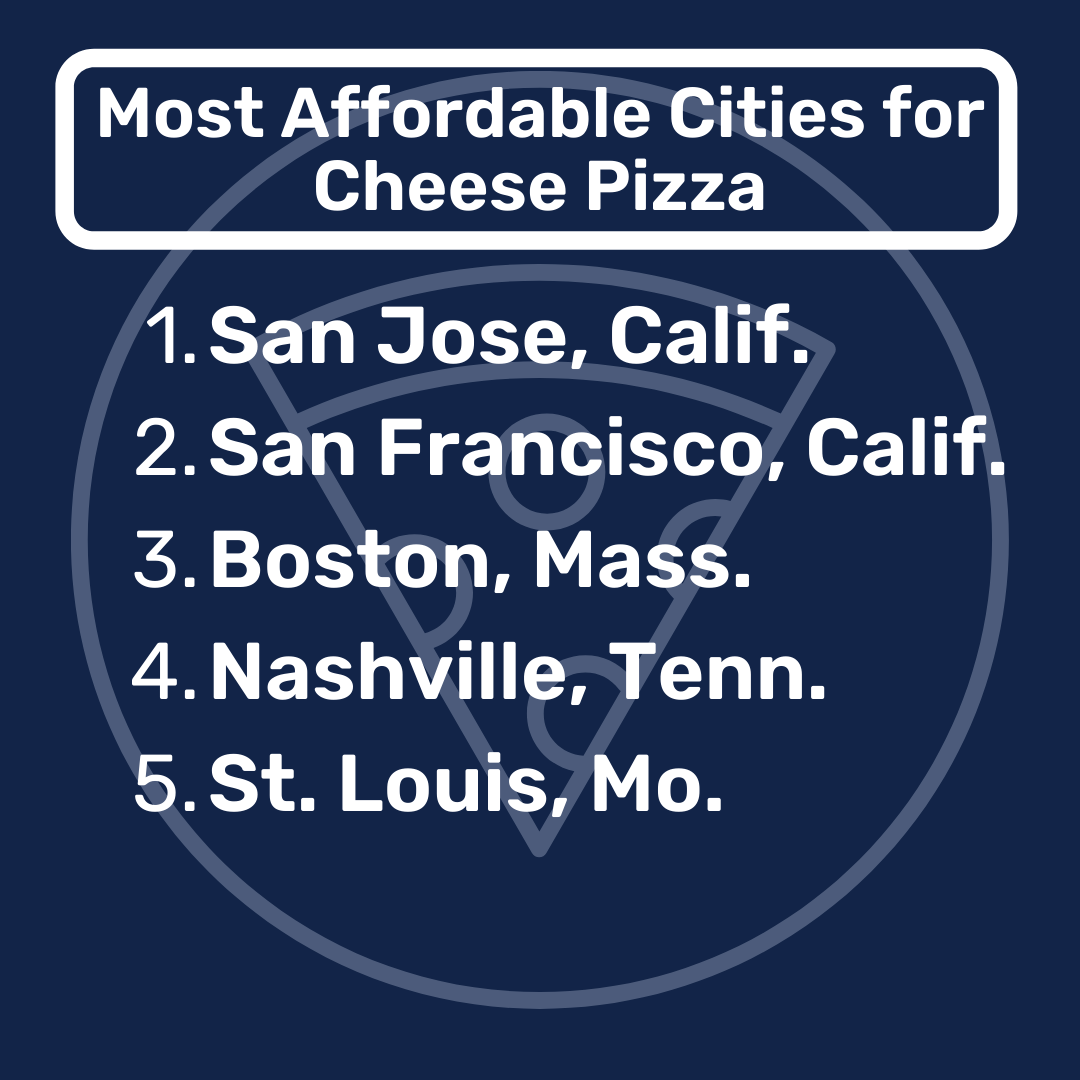
| 💰 Gateway to the Best PricesSt. Louis is the top city for deals on cheese pizza. Across all slices and pie sizes, the average local price of $6.61 is 23% cheaper than the average of the 50 cities we studied ($8.54). |
The Gateway to the West has an impressive pizza culture, ranking No. 6 in independent pizzerias per person (4.4 per 100,000 residents) and No. 7 in overall pizza restaurants (10.9 per 100,000 residents).
St. Louis comes in at No. 6 nationally for pizza passion, with a 28.4% higher average Google Trends rating across the pizza varieties we analyzed compared to the typical city in our study.
St. Louis also has its own style of pizza: Hometown favorite Imo's serves the dish in shareable squares complete with a thin, crispy foundation and Provel cheese blanketing every inch.[1]
9. Philadelphia, Pennsylvania
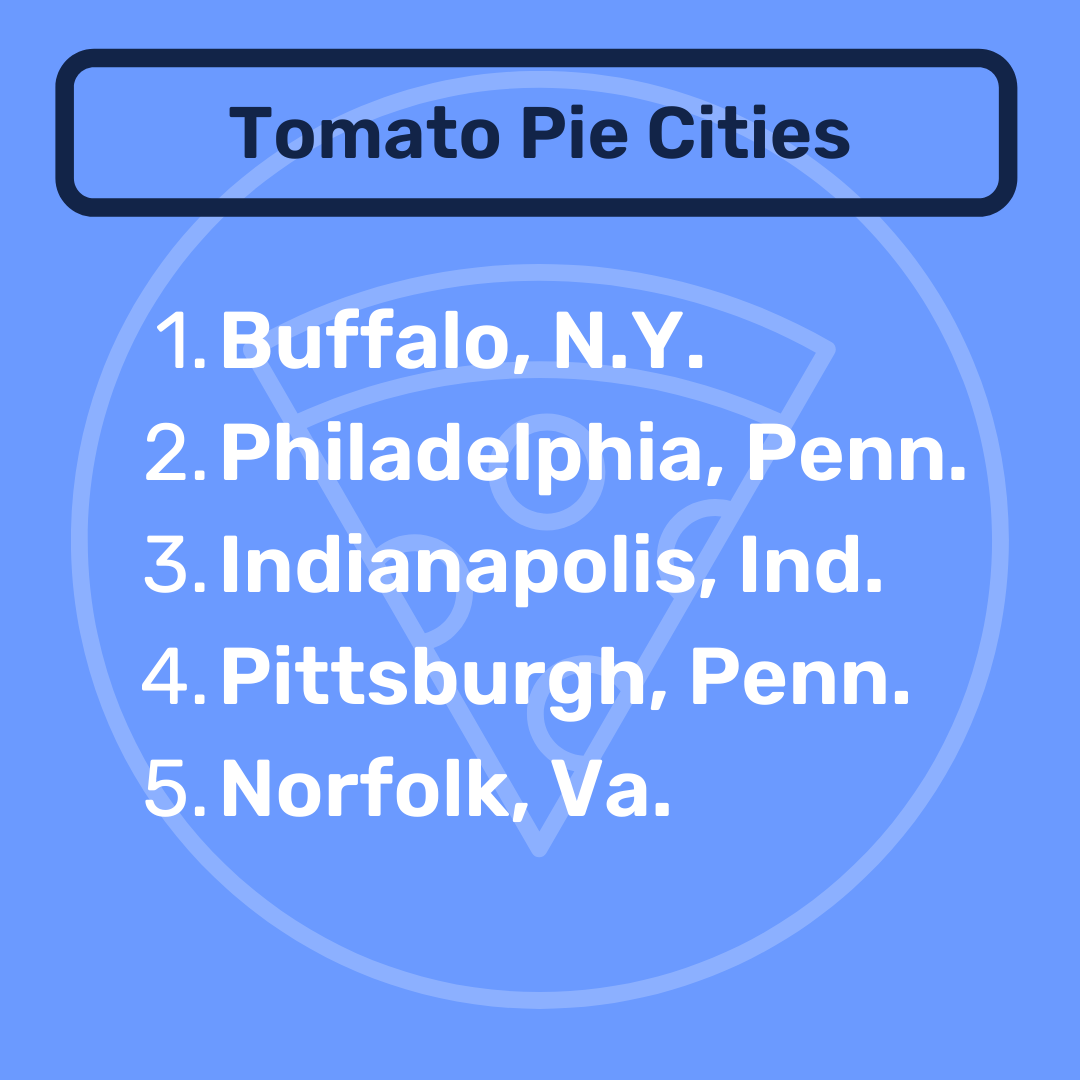
| 👀 Eyes on the Pies Philadelphia ranks No. 2 nationally in search interest for tomato pie — behind only Buffalo. |
Philadelphia food culture is about more than just cheesesteaks. Philly-style tomato pie is served colder than other types of pizza and substitutes a bit of parmesan in place of mozzarella on top of a spongy base.[1]
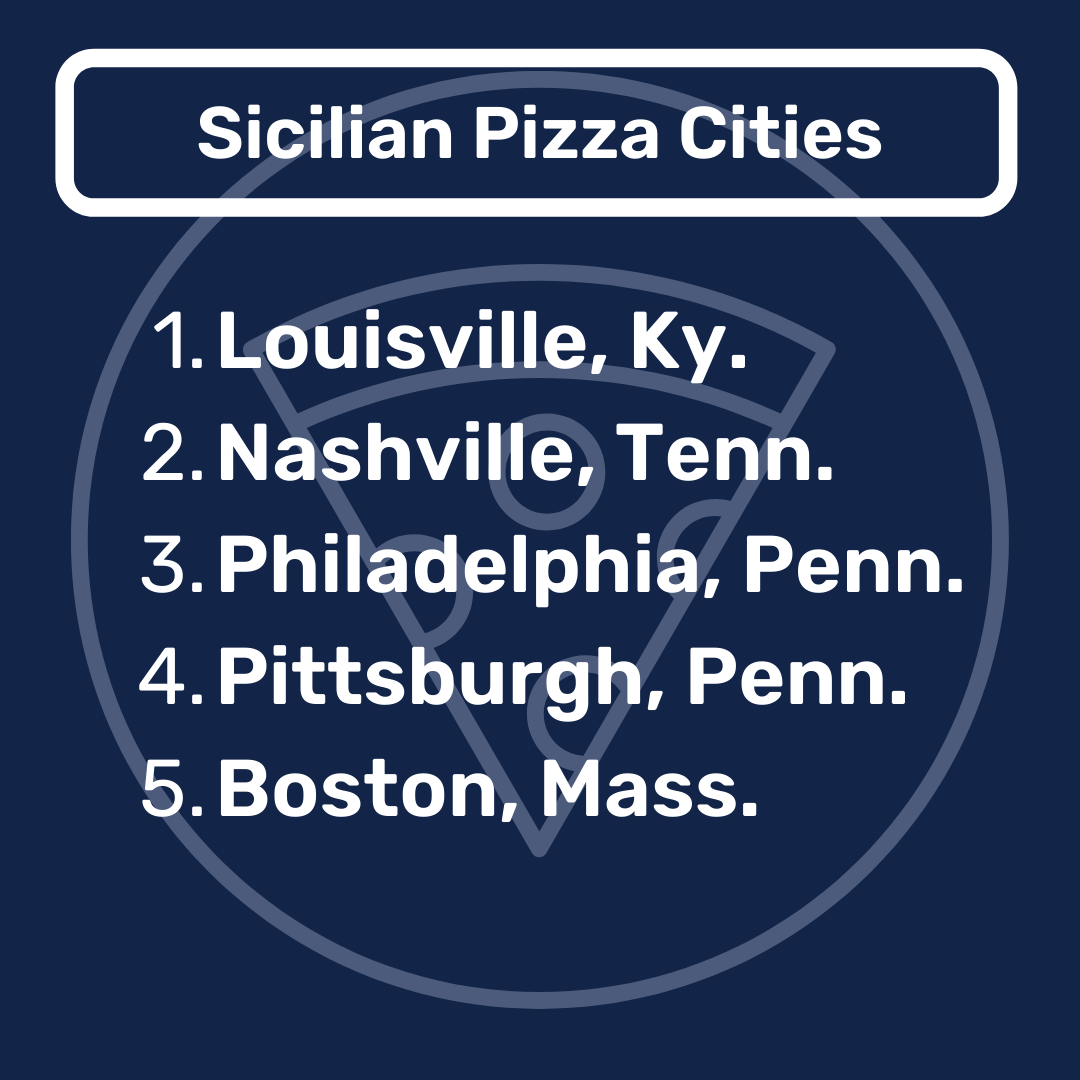
Fans of Philadelphia 'za are open to other varieties of pizza as well. The city ranks No. 2 in search interest for pizza Margherita and No. 3 for Sicilian style. The city has the eighth-highest spot in our pizza passion metric, with a Google Trends rating
18% higher than the average city we looked at.
With a pizza parlor every 1.57 miles (44% closer than the typical city we analyzed), you don't need eagle eyes to spot a good pizza joint in Philadelphia.
10. Norfolk, Virginia
| 🥂 A Toast to the Coast People in Norfolk should be in high spirits thanks to the second-lowest pepperoni pizza prices out of the 50 cities we measured (averaging $6.51 across all sizes). |
This city by the river really delivers. Norfolk (along with Virginia Beach) ranks No. 1 in search interest for both meat pizza and New York-style pizza. The metro area has a wealth of New York-style options such as Sal's NY Slice Pizzeria in neighboring
Virginia Beach.[1]
Norfolk has 3.7 independent pizza restaurants per 100,000 residents — 20% better than the average city in our sample.
11. Baltimore, Maryland
| 🍽️ A Raven-ous AppetiteBaltimore residents aren't satisfied with plain pizza alone, ranking No. 1 in search interest for pizza bagels and pizza Margherita. |
The home of the Ravens supports an extra-large amount of independent pizzerias. Baltimore boasts 3.9 independent pizza parlors per 100,000 residents — 24% more than the average city in our study.
Baltimoreans don't have to travel far to find a nice slice: The city has a pizza shop every 1.74 miles, 38% closer than the average city's distance of 2.82 miles.
12. Tampa, Florida
| ☀️ Pride of the Sunshine StateTampa shines as Florida's highest-ranking city for pizza — no small feat in the nation's third-largest state. |
Home of the NHL's Lightning, Tampa residents can find quality pizza in a flash. The city has a restaurant every 1.75 miles, 38% better than the average city we studied. Tampa also has 4.3 independent pizza restaurants per 100,000 residents —
seventh-most of the cities we measured.
Fans of Tampa pizza must have an affinity for the Mediterranean, as the city ranks No. 4 in search interest for Greek pizza and No. 5 in interest for Neapolitan pizza.
13. Minneapolis, Minnesota
| 🏞 A Winner in the West Not in the East? You can still feast on pizza in Minneapolis, the westernmost city to rank in the top 15 for pizza cities. |
Minneapolis has a soft spot for a wide variety of pizzas. The city ranks top 10 in our pizza passion metric due to a 15% higher average Google Trends rating across different pizza variations when compared to the average city in our study.
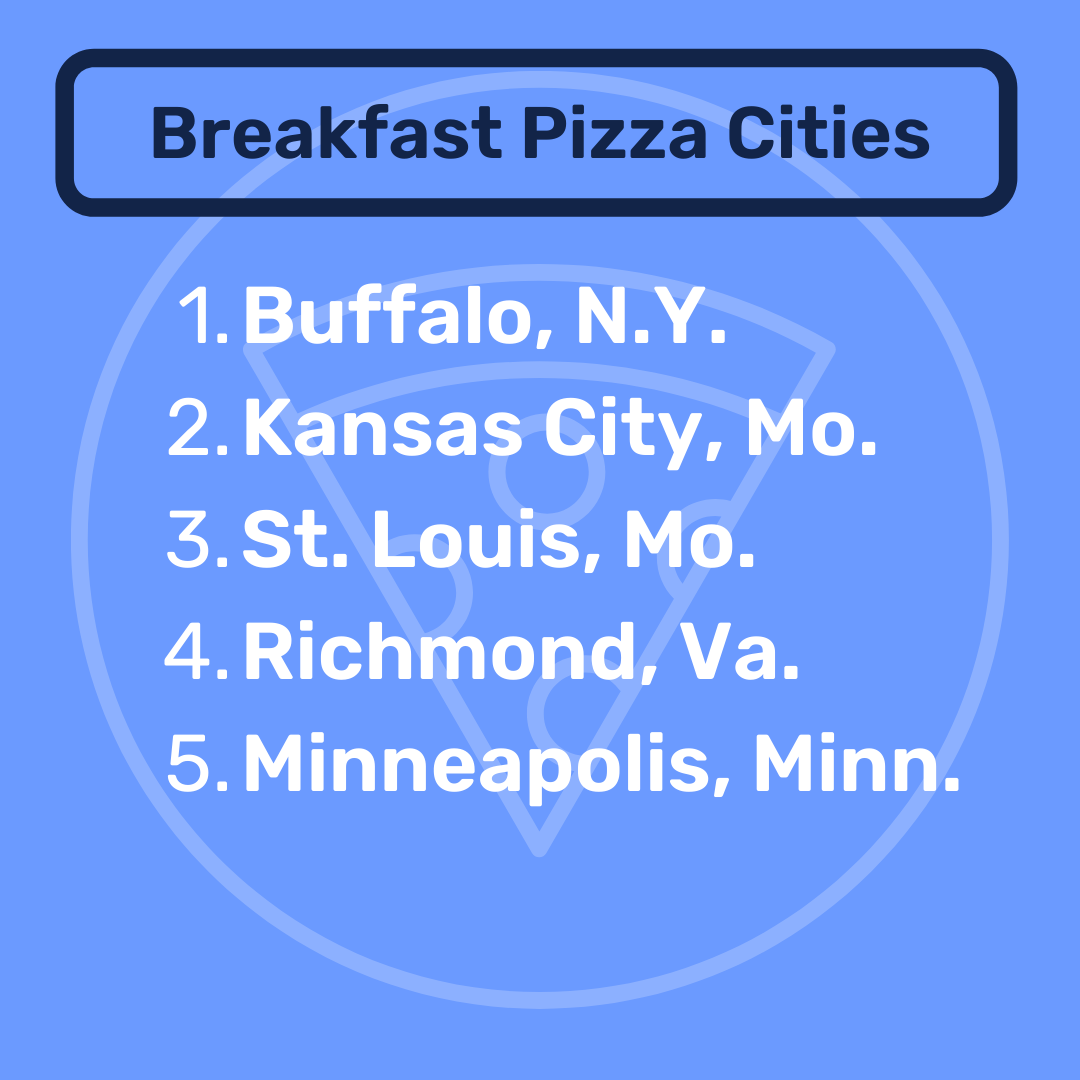
Minneapolis also finds itself in the top five in search interest for breakfast pizza, sausage pizza, BBQ chicken pizza, and veggie pizza.
14. Chicago, Illinois
| 🐻 Better Than the Average BearThis Midwest metropolis has a pizza place every 1.89 miles — 33% closer than the average city measured. |
Our data shows Chicagoans value a wide mix of pizza styles. With a 37% higher average Google Trends rating across 20 pizza variations, the city stands out as No. 2 nationally in our pizza passion metric.
The Windy City ranks No. 1 in search interest for Chicago-style pizza — no surprise there — and No. 2 for search interest in sausage pizza.
15. Nashville, Tennessee
| 🎶 Songwriters and 'Za Biters Music City marches to its own beat when it comes to pizza, with 3.7 independent pizza shops per 100,000 residents — 18% higher than the average city in our study. |
More like Noshville: Our data shows locals have a knead for doughy Sicilian pizza, with the second-most search interest of any city in our study in regards to the Italian island's style.
Nashville residents can save their money for music venues thanks to low prices on cheese pizza. With an average cost of $6.65 across all sizes (slices and pies averaged together), cheese pizza is 22% cheaper for Nashvillians compared to the average city
we analyzed.
[inline-image url="f7f96b70-94e6-11ec-96f2-43bdd99faa64-shutterstock399233794.png" alt="NY image"]
Perceptive pizza connoisseurs might notice New York City is absent from our top 15. Let us address any sauce-spicions: Although the Big Apple definitely has many positives for pie-lovers, its pizza culture has a fair share of flaws.
On the plus side:
- New Yorkers can find pizza with little effort, as the city has a pizzeria every 1.2 miles, 57% closer than the average city we studied.
- New Yorkers on average have more dough to spend. As a result, a weekly pepperoni pizza runs them only 0.48% of their average annual income compared to the 0.71% average among the 50 metros we analyzed.
As for the downsides of New York's pizza scene:
- New York has a lackluster share of independent pizzerias. With just 1.5 independent pizzerias per 100,000 residents, it's half the average of 3.1 per 100,000 across the 50 cities we looked at.
- Locals don't show much of an interest in different styles of pizza, with a 14.7% lower average Google Trends rating across the 20 pizza variations we analyzed.
- New York has 7.7 overall pizza shops per 100,000 residents (including chains), lower than the average of eight among all 50 cities we included in our research.
That's not to say we're sleeping on the city that never sleeps — New York still finishes in the top half of our rankings at No. 22.
» MORE: The Most Bike-Friendly Cities in the U.S.
 |
 |
 |
 |
 |
 |
 |
 |
We can't pan-der to every town. Of America's 50 most populous cities, these 10 were the least impressive, according to the metrics we used:
- Riverside, California
- New Orleans, Louisiana
- Birmingham, Alabama
- Houston, Texas
- San Antonio, Texas
- Miami, Florida
- Memphis, Tennessee
- San Diego, California
- Phoenix, Arizona
- Austin, Texas
When taken as a group, the bottom 10 pizza cities had just 2.6 independent pizza shops per 100,000 residents — 16% worse than the average of 3.1 in the cities we reviewed.
This slice of our 50-city sample has scant pizza passion, according to residents' search interest in a mix of pizza styles, displaying a 20.6% lower average Google Trends rating across the 20 varieties we analyzed. Residents in these 10 cities would also
have to dish out 0.82% of their annual average income to afford a weekly pepperoni pizza, higher than the 0.71% average across all metros.
Of the 50 cities we looked at, the data was most down on Riverside — in part due to high pepperoni pizza prices and a low pizza-to-people ratio:
- Riverside has just 5.37 pizza restaurants per 100,000 residents, making it bottom five in pizzerias per capita.
- Riverside residents seem ambivalent about trying a wide variety of pizza styles, earning the second-lowest score in our pizza passion metric that analyzes Google Trends to measure interest in a mix of pizza variations.
- Riverside ranks in the bottom three for density of pizza shops. The city has a pizzeria every 5.88 miles, double the typical 2.82 miles for the average city we evaluated.
- Taking all slices and sizes into account, pepperoni pizza costs about $9.72 in Riverside, 16% more expensive than the average $8.39.
If it's any consolation, Riverside residents, your city ranks No. 2 in search interest for Hawaiian pizza and No. 4 for California-style pizza.
Anytime Estimate compared the 50 most populous U.S. metro areas across a number of metrics, listed below. Each metric was normalized and then graded on a 100-point scale. The combined weighted average of the scores determined the “pizza city”
score upon which the final ranking was based.
In cases where data sets included only cities or other statistical areas, the city data was combined into the overall metro in which the city belonged to the extent of the available data. In cases where data sets included only counties, county data was
crosswalked with metropolitan data. In cases where data sets included only states, the state where the largest portion of the metro is located was used.
The metrics used are as follows:
- Google Trends pizza varieties (31.25%)
- Google Trends pizza practical terms (12.5%)
- Total pizza restaurants per 100,000 citizens (18.75%)
- Chain pizza restaurants per 100,000 citizens (-6.25%)
- Independent pizza restaurants per 100,000 citizens (6.25%)
- Pizza restaurants per square mile (12.5%)
- Price of "cheese pizza" (6.25%)
- Price of "pepperoni pizza" (6.25%)
- Weekly cheese pizza per year for the average resident as a percent of total income (6.25%)
- Weekly pepperoni pizza per year for the average resident as a percent of total income (6.25%)
Data sources include: U.S. Census, Bureau of Economic Analysis, Bureau of Labor Statistics, Google Trends, Thrillist, Pizza Today, US Business Data, Expensivity, and Menu With Price.
Article Sources
About Anytime Estimate
Stay on top of your money, around the clock. Since 2009, Anytime Estimate's straightforward calculators and expert articles have simplified mortgages, refinancing, and other real estate costs — fast. In 2021, Anytime Estimate was acquired by Clever Real Estate, a free agent-matching service that has helped consumers save more than $82 million on real estate fees. Research by Anytime Estimate's Data Center has
been cited by The New York Times, CNBC, MarketWatch, NPR, Apartment Therapy, Yahoo Finance, Black Enterprise, and more.
FAQs
What's the best pizza city in the U.S.?
Detroit is the best pizza city in the nation. Detroit has the most independent pizzerias per capita, and its residents have the biggest appreciation for a variety of pizza styles, according to search data. <a href="https://anytimeestimate.com/research/best-pizza-cities-2022/" style="color:blue">Learn more.</a>
What city has the most pizza?
Pittsburgh has the highest number of pizza restaurants per capita in the U.S. with 15.2 pizza places per 100,000 residents — 90% more than the average U.S. city. <a href="https://anytimeestimate.com/research/best-pizza-cities-2022/" style="color:blue">Learn more.</a>
What city has the cheapest pizza?
The best prices for pepperoni pizza are in Salt Lake City (24% cheaper than the average metro). The best prices for cheese pizza are found in St. Louis (23% cheaper than the average city). <a href="https://anytimeestimate.com/research/best-pizza-cities-2022/" style="color:blue">Learn more.</a>